
Bringing innovation to advertisement through single-source data
We see advertisements every day—on TV, newspapers, magazines, the Internet, and more. But are these advertisements really having the sort of effect that their owners (companies) want them to have? The Nomura Research Institute (NRI) Insight Signal business was established in 2007 to tackle this kind of issue. Insight Signal uses its very own single-source data to support company marketing efforts, from helping propose strategies to measuring advertising effectiveness. We asked Junichi Shiozaki, who has been involved with this business since its inception, how Insight Signal is influencing the world of advertisement.
“We want to communicate the company’s ideas”
—— What kind of things does Insight Signal do?
We provide a service that uses original data to measure advertising effect for the owner of the advertisement (company). There are a lot of intuitive, subjective elements when you evaluate an advertisement. So we thought there was a need for a third party like us, neither an advertising agency or a form of media, to provide scientific measurements using objective data. But when we first came up with this business in 2005, this kind of data just wasn’t there. So we thought—if it’s not there, we have to make it ourselves. So we gathered and analyzed data on our own to create this business.
—— What is single-source data?
In the past, data collection was different depending on the type of media—ratings and reach for TV, number of readers for magazines, etc. Single-source data, however, is collected by asking the same person about their purchasing behavior before and after they are exposed to multiple kinds of advertisements, whether it be media exposure or a published advertisement. This allows single-source data to capture the relationship between purchasing behavior and the cross-sectional use of media, media exposure, and more. Data is collected through a survey of 3,000 people spanning 2 months. The survey looks into individual exposure for various types of media like TV, newspapers, and magazines, as well as level of exposure to commercials, purchase intention, and actual purchasing behavior.
This method of data collection incurs large costs. However, through trial and error we’ve found a balance between cost and data accuracy, and have been able to provide our service through a “multi-client system,” which allows us to decrease costs by having multiple companies use a shared data infrastructure.
Likeable advertising Good advertising
—— What can an analysis of single-source data reveal?
We’re able to objectively and scientifically analyze the effectiveness of the advertisements, and gain an understanding of the true causes behind their success or failure. In the past, advertising effectiveness was measured in terms of things like publishing volume, exposure ratio, and likeability. So when a product didn’t sell well, they would assume the cause was the amount of supply or the price range, and if a product started selling well, they wouldn’t know the concrete reason behind it, especially because purchasing intention can fluctuate depending on social factors like seasonal variation and changes in law as well. Using single-source data, we can measure advertisement effectiveness simply through the amount and quality of the advertisement itself. It makes clear which advertisements are ineffectual and don’t lead to any kind of purchasing behavior, which ones would have led to more sales if only there had been more volume, and even what kind of message would have increased purchasing intention in potential customers.
—— How do you analyze the data?
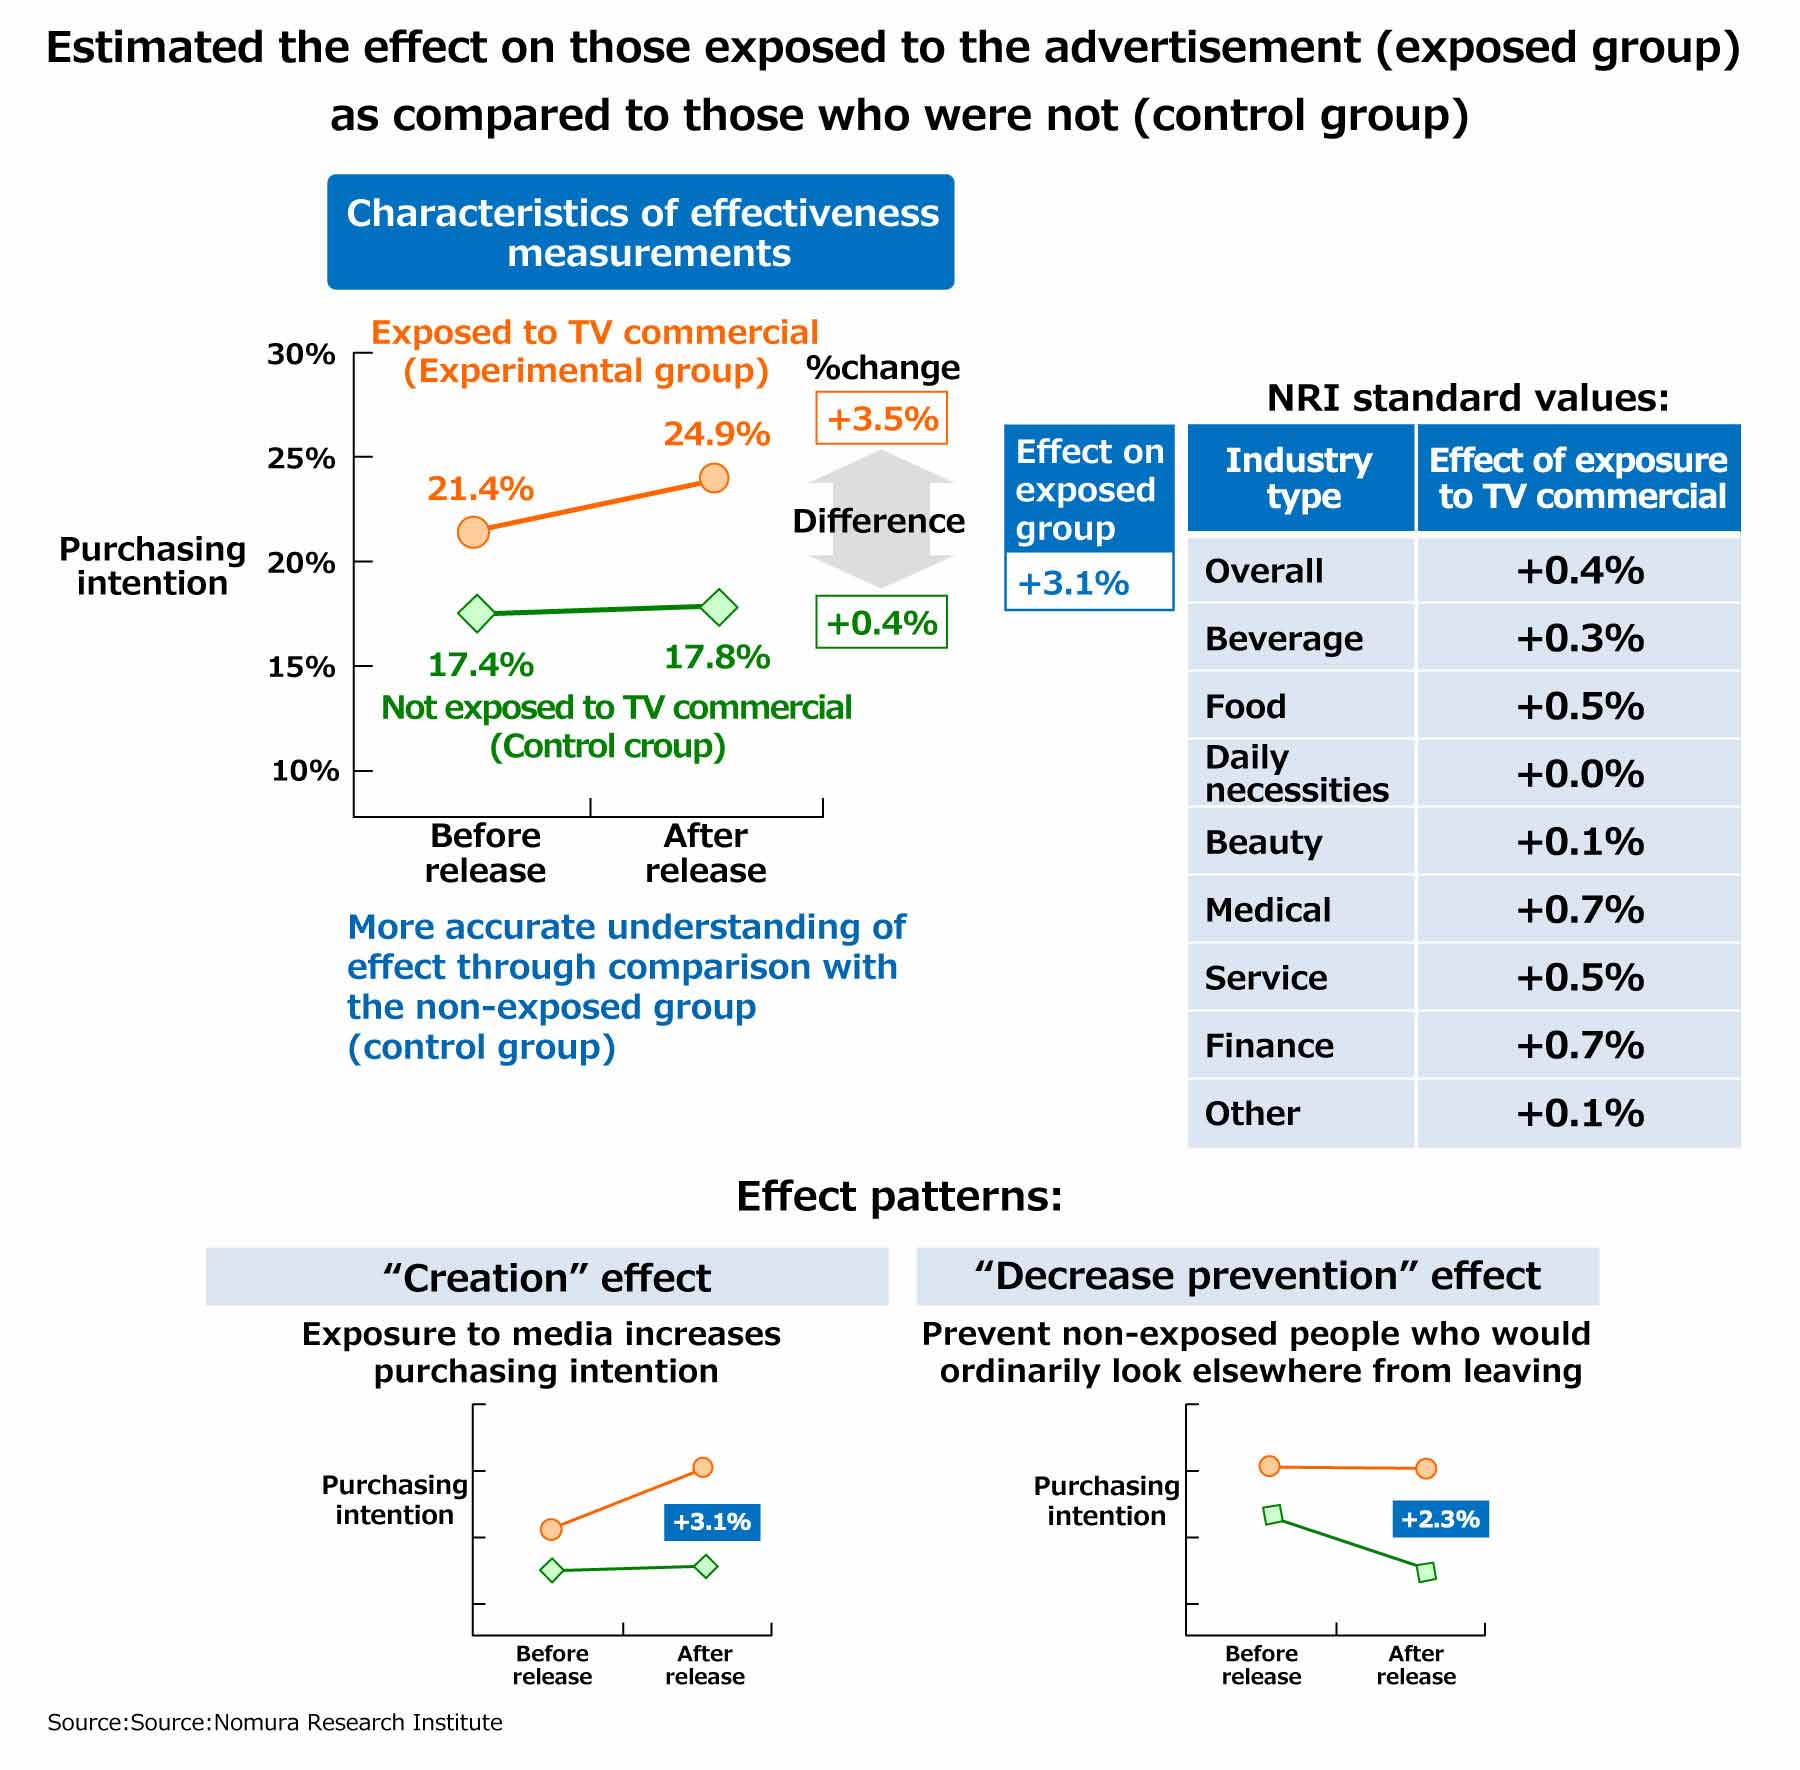
Effectiveness is calculated using the “differences-in-differences” method. In a nutshell, it compares the difference in numerical value between those who have been exposed to a TV commercial (exposed group) vs. those who have not (non-exposed group). If purchasing intention is increased only in the exposed group after the advertisement is released, this increase could be considered an effect of the commercial. If, on the other hand, purchasing intention increased simultaneously in the non-exposed group as well, it would mean there was some external factor outside the scope of the commercial. The same method is used to measure the effects of creativity in advertising. Comparing the statistics between those who recognized each creative element in an advertisement vs. those who did not allow us to figure out what message, video, etc., had the highest impact on the target population.
—— What kind of response did you get when you started the service?
One company told us that our service was almost as revolutionary as the discovery of zero in India, which was quite striking to hear. Our approach to advertising, which attempts to discern ineffectual and negative-effect advertisements and improve on them, was likened to the revolutionary invention of the concept of “zero.”
If you look at the straightforward data on advertising effectiveness, you can see that there are advertisements that are highly likeable but have not translated into sales, as well as advertisements with low recognition that still manage to promote their respective products to the target population. We really feel the effectiveness of our research when we see the ways our clients reflect the results in the creative aspect of their advertisements. We do feel pressure when we hear stories about how our clients include our results in their business reports, but we’re also thankful, because it makes us realize how important data is to them.
Towards further evolution, while incorporating new technologies
—— It’s difficult to create a business from scratch. What kind of attitude did you have going into it?
Consulting is normally a service that’s provided through people. This new business was going to provide a service through data, and so it did take a long period of trial and error.
In recent years, there’s been a focus on asset-based consulting services, which use data analytics and original data to provide services much like ours. But we began providing our service ten years before this wave, and have managed to differentiate ourselves from the competition through our accumulation of expertise, and the results we have achieved. We’re starting to feel that client attitudes towards advertising are shifting as well.
—— What are the things we have to consider to make proper use of single-source data?
Single-source data allows you to understand an advertisement from various perspectives. As such, it’s important to make your goals clear—what you want to know, what you want to improve, etc. Our clients tend to say they want to improve everything, from purchasing intention to recognition, but different forms of media have to be used in different ways depending on the objective. We can only propose plans for improvement if we are able to engage in focused analysis. For that, the client must make clear what they wish to accomplish with the advertisement.
—— Finally, could you tell us the future outlook of the Insight Signal business?
Currently, we are in discussions to create a new NRI ad-analysis AI capable of evaluation and analysis of the creative elements in an advertisement, using our ten years’ worth of accumulated data. We believe it is our mission to unearth such new perspectives, and utilize our data and our neutral position to help clients solve their issues.
Profile
-
Junichi Shiozaki
* Organization names and job titles may differ from the current version.