Apr. 30, 2020
Summary
- A Bayesian structural time series model is a time series model with excellent flexibility and readability that enables structured representation of trends, seasonality, and the impacts of exogenous variables that have complex effects.
- This proposal presents a model of the impact of Covid-19 on the sales of listed companies on the basis of the macroeconomic forecast results calculated by Nomura Securities in February and March 2020, before and after the effects of Covid-19 became apparent.
- As a result of the above, the impact on the sales of listed companies is estimated to be about 108 trillion yen, the industry with the largest impact is the transportation equipment industry, and the peak impact is predicted to be the first quarter of 2020.
- Going forward, we plan to revise our predictions in conjunction with the latest macroeconomic forecasts, and to offer more detailed analyses of each industry from time to time.
Characteristics of a Bayesian Structural Time Series Model
A structural time series model is a kind of state-space model, and is a model that can separately express different components (trends, seasonality, etc.) existing in a time series. As one example of this, in 2017, Steven L. Scott proposed a Bayesian structural time series model that can take in various exogenous variables in addition to components such as trends and seasonality*1. Generally, time-series data has a small number of points (e.g., even if there is monthly data for five years, there are only 60 points) and is not good at incorporating a large number of explanatory variables, but in a Bayesian structural time series model, a "spike and slab" regression:*2 is applied to the explanatory variables and the degree of influence of each variable on the prediction is updated by a Bayesian approach, making it easier to adopt some important variables, while other variables become more difficult to adopt. As a result, the model is capable of achieving improved model stability when a large number of exogenous variables are inputted, and expressing which variables are more important in a probabilistic manner.
Modeling the Impact of Covid-19 on Different Industries
In this proposal, using the above model, we forecast the quarterly sales of listed companies in each industry up to FY2021, using forecasted of macroeconomic indicators as explanatory variables. The data used to create the model are as follows.
We will use specific cases to demonstrate the rationale and results of the model.
1.Setting the Objective Variables
First, among all the companies listed on the Japanese stock exchanges, the subject companies are those that had sales in the third quarter of 2019. The objective variable is the aggregated quarterly sales by industry of each of these companies from 2007 to the third quarter of 2019*5.
2.Setting the Explanatory Variables
The explanatory variables used are 18 types of macroeconomic indicators, including GDP, in addition to the characteristics of the series itself, such as trends and seasonal factors. These are based on the indicators forecast by Nomura Securities in the economic forecasts conducted in February and March 2020.
3.Structure and Interpretation of Model
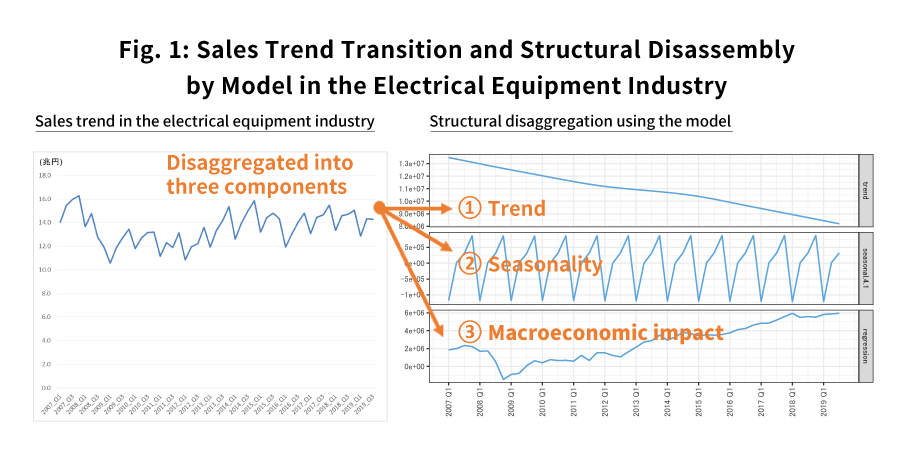
As discussed above, the main characteristics of a Bayesian structural time are that a) the model structure can be expressed in a disaggregated manner, and b) the importance of each explanatory variable can be evaluated. First, the characteristic of a) will be explained taking the electrical equipment industry as an example. The left side of Fig. 1 shows the sales trend in the electrical equipment industry since 2007. It is disaggregated into three components using a Bayesian structural time series model. The first of these is the trend. Although the market appears to be flat, the model estimates that the underlying market trend is declining, as the market is not growing relative to macroeconomic growth. The second component is seasonality. The model captures the cyclical trend of increasing sales from the first quarter to the fourth quarter and peaking in the third quarter. The third is the effect of explanatory variables, which in this model show the effect of macroeconomic indicators. It can be seen that the impact of the Lehman shock was most pronounced starting from the latter half of 2008, but since then the impact of the earthquake and that of the consumption tax hike etc. have been relatively minor, and overall it is judged to have been on an upward trend for several years.
The above is an explanation of the feature
a) that the model structure can be expressed in a disaggregated
manner.
Next, we will explain
b) that the importance of each explanatory variable can be
evaluated by giving an actual example.
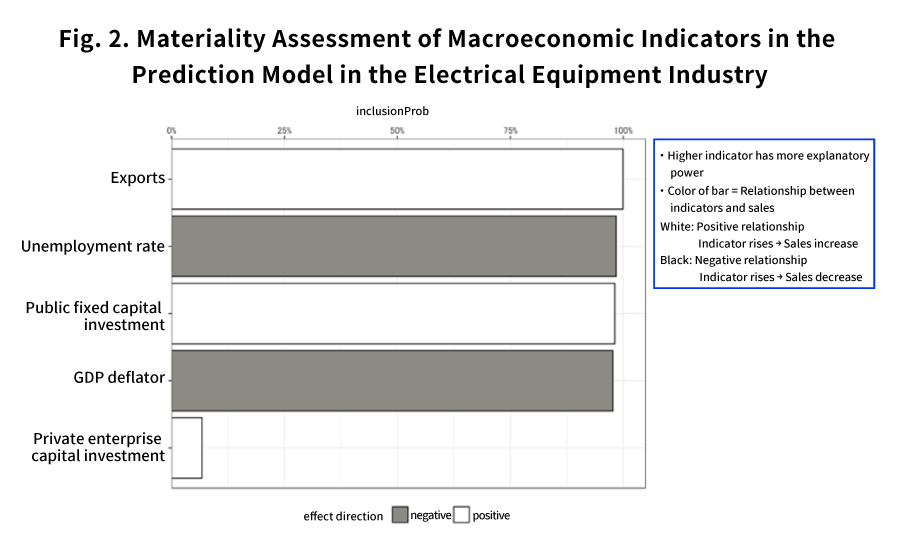
Fig. 2 shows “Inclusion Probability”, which is the probability that
the regression coefficient of each economic index is not 0 (i.e.,
impacts the predictions of the model)*6. For example, in
the figure below, “export” is adopted as an explanatory variable
with a probability of almost 100%, while “private enterprise capital
investment” has a probability of adoption of less than 10%, and the
impact is relatively small.
Further, the color coding of the bar on the graph shows the
relationship between each index and the amount of sales. White
indicates a positive relationship, and black indicates a negative
relationship. For example, taking the unemployment rate as an
example, it is natural to think that the lower the unemployment rate
is, the better the economy will be and the more positive it will be
for sales, and it is natural to assume a negative relationship. The
bars on the model are also represented as black, suggesting a
negative relationship. In practice, it is important to adopt
appropriate explanatory variables from the perspective of business
and interpretability in view of the relationship between explanatory
variables and objective variables as described above.
4.Estimating the Impacts of Covid-19
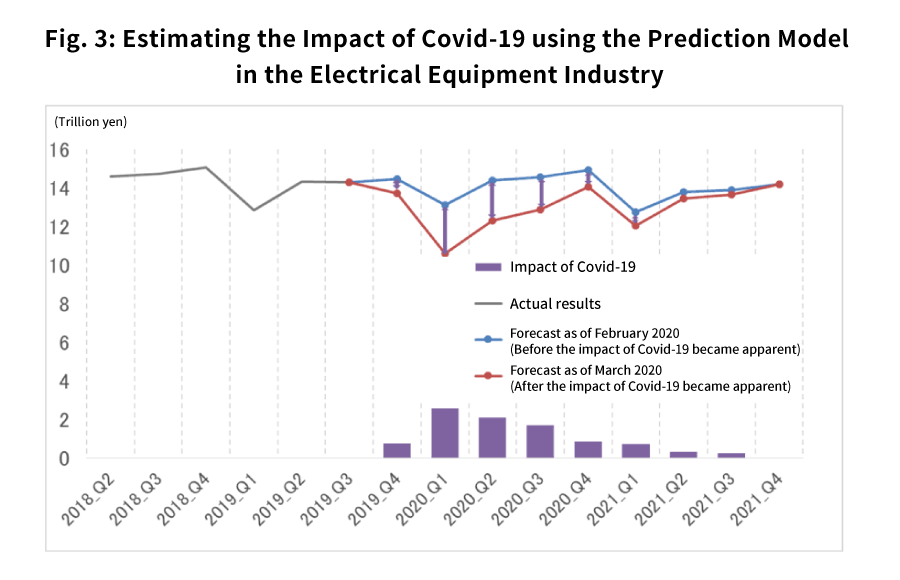
This proposal aims to estimate the impact of Covid-19 by the difference between the forecasts of economic indicators before (as of February 20) and after (as of March 20) the impact of Covid-19 became apparent. See Fig. 3 for details. First, the actual results are shown as a gray line until the third quarter of 2019. The blue line is the sales forecast of the electrical equipment industry based on the forecast of macroeconomic indicators as of February 2020. As of February 20th, although the impact of Covid-19 was expected, it was mainly discussed in terms of the Chinese economy, such as a decrease in inbound demand due to the shutdown of major cities in China and a decrease in exports to China, and it was thought that the impact would be relatively minor. Meanwhile, the red line is the forecast as of March 2020. This is a scenario that considers the effects of the stagnation of the world economy and the decrease in domestic consumption due to stay-at-home guidelines. In this paper, the purple difference bounded by these two lines is defined as "the impact of Covid-19 on listed companies." In the electrical equipment industry, the impact of Covid-19 was in full swing and at its greatest in the first quarter of 2020 and has been gradually diminishing, but it is estimated that the downward trend will continue until the third quarter of 2021. Naturally, the scale and duration of impacts will differ from industry to industry. In the next section, we list the estimation results by industry and consider the overall trend.
Forecast Results
Table 1 shows the estimated impact of Covid-19. Regarding the impact
on all listed companies from the fourth quarter of 2019 to the
fourth quarter of 2021, the loss due to Covid-19 is forecasted to be
about 108 trillion yen*7. This is about 6% of total
sales, and is expected to reach about 11% in the first quarter of
2020, which will see the greatest impact. Although it will later
recover from the impact, it is expected that it will be difficult to
regain the sales that would have been achieved in 2021 had Covid-19
not occurred.
The CFO Survey, regularly conducted by Professor John Graham of Duke
University for more than 20 years, has surveyed CFOs around the
world about the outlook for sales in the coming year. According to
the results of the survey conducted starting on March 15, 2020, CFOs
in the Americas and Europe expect sales to decline by 1-2% in the
most likely cases, and by about 15%. in the worst case
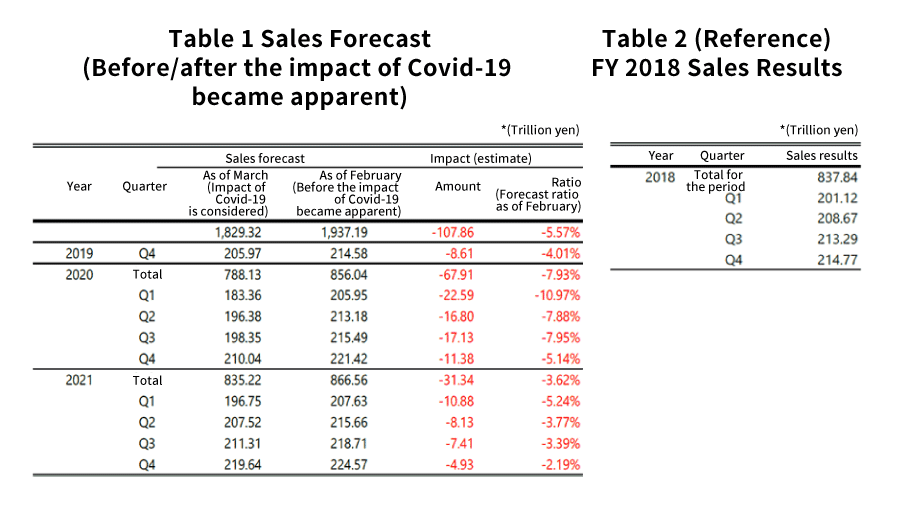
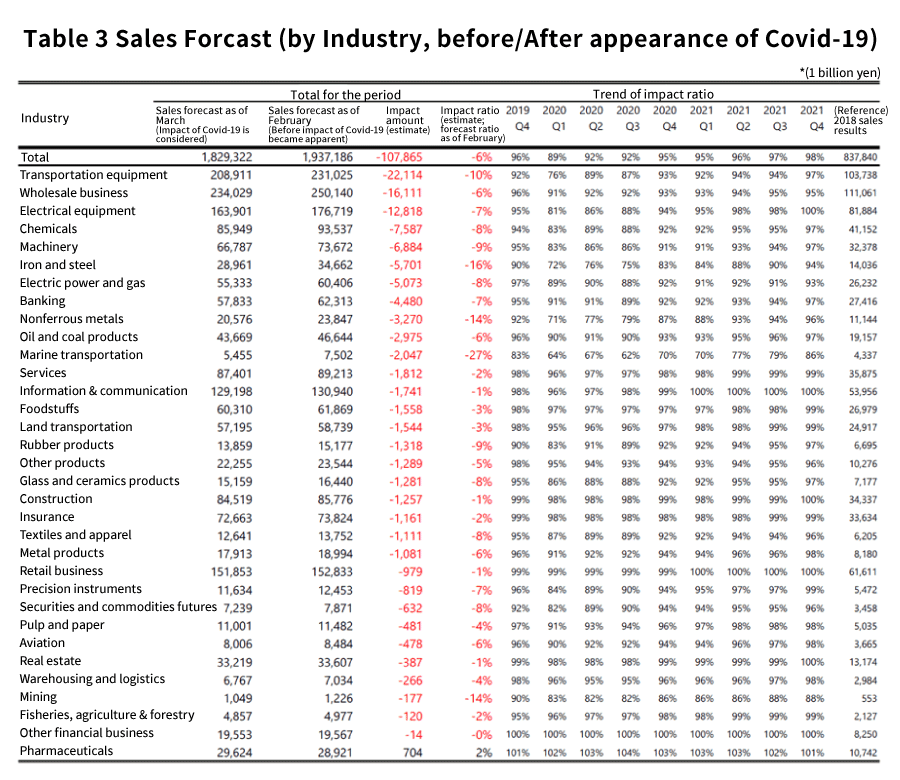
Table 3 shows the impact forecast by industry. The industries that
are expected to experience a particularly large impact are equipment
manufacturers, with transportation equipment manufacturers being
representative examples of this. Their businesses are highly linked
to the economy and are expected to be the most affected. In
addition, a large decrease is forecasted in industries that are
easily affected by the import and export situation of steel and
other commodities. Meanwhile, the impact on retail foodstuffs with
strong domestic demand and the pharmaceutical industry is relatively
small. This is probably because a certain amount of demand is stable
regardless of economic fluctuations. The impact forecasted here is
based on the economic outlook and does not take into account the
impact of the restriction of movement peculiar to measures for
Covid-19 (e.g., air transportation).
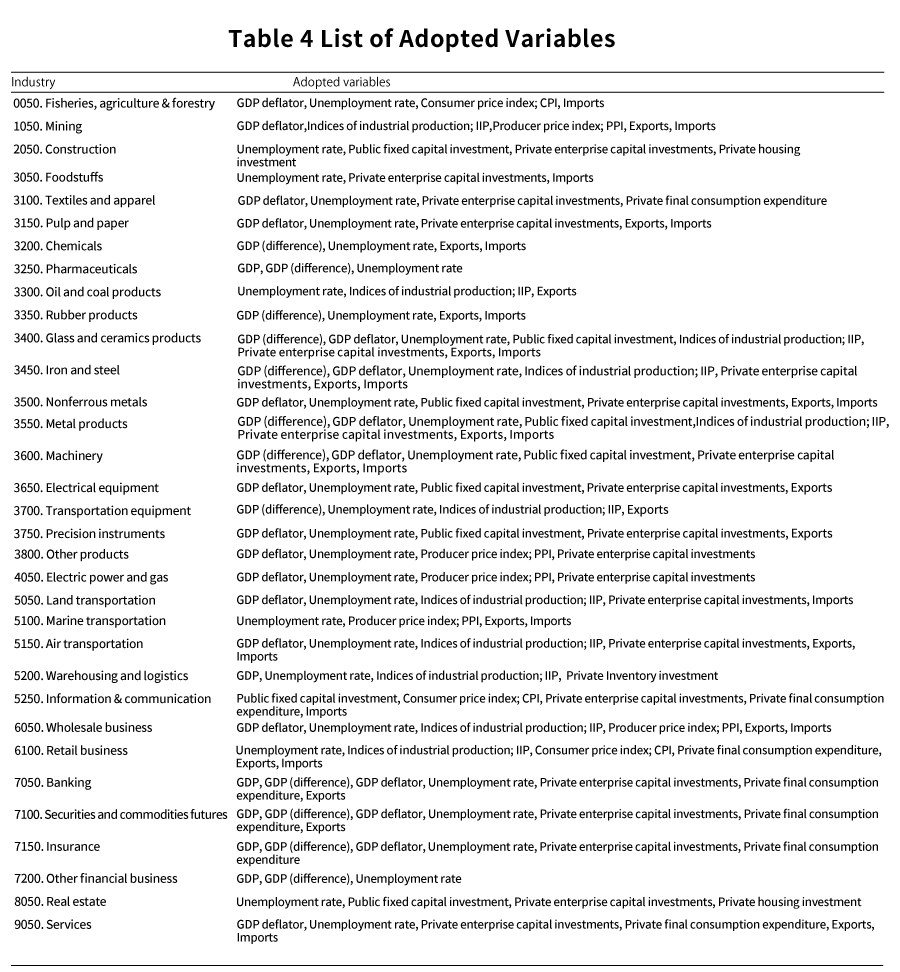
The variables used for prediction have been selected using a
statistical model, but the variables mainly used in the model are
listed in Table 4. GDP, fluctuations thereof, the unemployment rate,
and imports and exports are used for most industries. For industries
with more BtoC business, consumer price indices are also used. For
industries with more BtoB business, forecasts consist of the GDP
deflator, which represents prices, as well as industrial production,
capital investment by private companies, and the like.
Proposal Based on Forecast Results
In this proposal, we estimated how each industry would be impacted
in accordance with the economic outlook by building our own
forecasting model. Of course, factors unique to Covid-19, especially
the direct restriction on the movement and activities of people, may
have a greater impact on some industries, and conversely, some
industries such as the telecommunications industry may not
necessarily experience a negative impact. In business activities,
proper forecasting is the first step in building the right strategy.
In public policy, a good estimate of the impact could give priority
to supporting industries that are likely to face more difficult
situations. We hope that the impacts estimated in this paper will be
used as the starting point for discussions, and from that point on
how much upside/downside is expected depending on industry-specific
trends will be examined.
Going forward, we will continue to update industry-specific
forecasts in conjunction with the revision of the economic outlook,
and we will also delve into specific industries and offer future
outlooks.
-
*1:
Steven L. Scott and Hal R. Varian, Predicting the present with Bayesian structural time series, International Journal of Mathematical Modelling and Numerical Optimization, Vol. 5, No. 1/2, 2014.
-
*2:
See *1 above for details.
-
*3:
“National Accounts” (Cabinet Office), “Industrial Production/Shipping/Inventory Index” (Ministry of Economy, Trade and Industry), “Corporate Price Index” (Bank of Japan, Research and Statistics Bureau), “2015 Consumer Price Index” (Ministry of Internal Affairs and Communications), "2010 Standard Consumer Price Index" (Ministry of Internal Affairs and Communications), "Labor Force Survey" (Ministry of Internal Affairs and Communications) (acquired March 31, 2020); however, 2010-based indicators were processed by NRI on the basis of 2015 standards.
-
*4:
Economic Research Department, Nomura Securities Financial and Economic Research Institute. "Economic Outlook for FY2019-2021-Economic Recovery Facing Lagging Risk", March 19, 2020, p.36.
Nomura Securities. "Japan: Revised Economic Outlook for 2019-2021", "Global Markets Research", March 27, 2020, p.3. -
*5:
As for companies for which some sales records could not be collected from 2007 to the third quarter of 2019 are not included in the modeling, expansion and industry-wide sales were estimated after the model was built.
-
*6:
Please note that, because the explanatory variables that were ultimately inputted were adjusted by the analysts taking into consideration the rationality of the degree of influence, causal relationships, and other factors, not all 18 types of economic indicators have been inputted.
-
*7:
Please note that this forecast uses the data of listed companies, and the impact would be greater if unlisted companies were included.
-
*8:
No official report has been published yet (as of April 24, 2020), but a video presentation (held April 22, 2020) at https://www.fuqua.duke.edu/linkedin-liveis available, so please check there for details.
Authors
Yudai Suzuki
DX Consulting Department
Nomura Research Institute
Shinpei Ikeno
DX Consulting Department
Nomura Research Institute
Shodai Manabe
DX Consulting Department
Nomura Research Institute
Yutaro Tachibana
DX Consulting Department
Nomura Research Institute
Ryo Nakai
DX Consulting Department
Nomura Research Institute
Contact Us
Media Inquiries:
-
Corporate Communication Department
Nomura Research Institute, Ltd.
TEL: +81-3-5877-7100
Inquiries about the proposals:
-
Center for Strategic Management & Innovation
Nomura Research Institute, Ltd.