Tokyo, November 06, 2018 - Nomura Research Institute, Ltd. (NRI), a leading provider of consulting services and system solutions, conducted a door-to-door survey of 10,000 men and women aged 15-79 across Japan in July – August 2018, in which respondents were asked about their lifestyles, values, and consumption habits. NRI has conducted this Survey every three years since 1997, with this last survey marking the eighth in the series.
The main results of the Survey are the following four points.
-
Trend towards individual activity using information terminals continues, taking away “family time”
The rate of personal smartphone ownership increased from 23% in 2012 and 52% in 2015 to 71% in 2018 (fig. 1). Weekday internet use time (excluding work use) increased from 103 minutes to 119 minutes in the past three years*, while television viewing time has decreased most notably among younger consumers, from 151 minutes to 145 minutes overall*. Japanese people are increasingly letting their spouses and family members be alone (fig. 2); as a result, “family time” where families spend time together in the same space is disappearing, and instead families are passing the time individually, using their own information terminals.
-
Income expectations somewhat improved, wait-and-see attitude with regard to the direction of the economy
While 11% of people thought that household income will improve, the same level as in the 2015 survey, the percentage of people who thought it would decline decreased from more than 40% in 2009 and 2012 to 24% in 2018, reflecting somewhat brighter income expectations (fig. 3)*.
With respect to the economic outlook for the following year, 40% of people thought the economy would decline in 2012, but that percentage fell to 22% in 2015, and decreased further to 19% in 2018. Meanwhile, people who responded “neither improve nor decline” increased from 54% in 2012 to 66% in 2015, and increased further to 69% in 2018, showing a growing wait-and-see attitude with respect to the economic outlook (fig. 4)*. Consumers overall have not felt deterioration in the economic environment in the past three years, but they have yet to feel secure about its direction.
-
Internet shopping use continues to grow, particularly among younger consumers
Internet shopping use and the average number of times people shopped online per year has greatly increased. The overall internet shopping rate increased from 49% in 2015 to 59% in 2018, up approximately 10 percentage points (fig. 5)*. Further, the average number of times consumers shopped online increased mainly among younger shoppers in comparison to the 2015 survey, with the overall number increasing from 14.8 times per year to 19.8 times per year*.
The survey also found that consumers are now getting their shopping information from “television commercials” and “radio, newspaper, and magazine” advertisements less frequently than in 2012, while increasingly checking “internet top-selling product information”, “review sites and blogs”, and other online information (fig. 6).
-
The overall shopping style continues to be focused on convenience, with a slight increase in premium preferences among double-income households
A look at the changing weights of the “four shopping styles” established by NRI reveals that the proportion of “convenience-focused shopping” (i.e., placing more importance on convenience than low prices when making purchases) was the highest, at 44% in both 2015 and 2018 (fig. 7)*. The “premium-focused shopping” style (i.e., paying for the added value of personal preferences) held steady at 22% of consumers overall, but increased 21% to 23% in double-income households*.
-
*
The survey pool for “internet use hours”, “television watching hours”, “income outlook”, and “economic outlook”, for “overall use rate” and “annual average number of times per shopper” for internet shopping, and for the “four shopping styles” was men and women aged 15-69.
[Reference] Survey Overview
| ■Survey name | (Eighth) Questionnaire Survey of 10,000 Consumers |
| ■Survey period |
July - August 2018 *Past surveys: 1997 1997, 2000, 2003, 2006, 2009, 2012, 2015 |
| ■Survey method |
Door-to-door |
| ■Sampling method |
Two-stage stratified random sampling |
| ■Survey subjects |
Men and women aged 15-79 across the country
* Men and women aged 15-69 until 2009 |
| ■Number of valid responses |
10,065 people
*Number of valid responses in past surveys: 1997: 10,052 people; 2000: 10,021 people; 2003: 10,060 people; 2006: 10,071 people; 2009: 10,252 people; 2012: 10,348 people; 2015: 10,316 people *For time series comparisons, responses from people aged 70-79 were excluded in order to compare the same age range (15-69). |
| ■Main survey items | |
| ◇Values | Beliefs in daily life, trust in organizations, agencies, and profession |
| ◇Communication | Attitude towards parent-child relationships, marital relationships, and community relationships |
| ◇Residence | Years at current residence, form of home ownership, housing preferences going forward |
| ◇Employment style | Employment status, attitude towards employment |
| ◇Consumer values | Attitude towards shopping, desired areas for actively spending money going forward |
| ◇Consumption | Household/personal goods owned, source of information for shopping |
| ◇Free time/leisure | Interests, internet use |
| ◇Life in general, life plans | Outlooks for economy and income, challenges and worries |
Fig. 1:Changes in Information Terminal Use (devices for which respondents have unrestricted individual use; multiple responses)
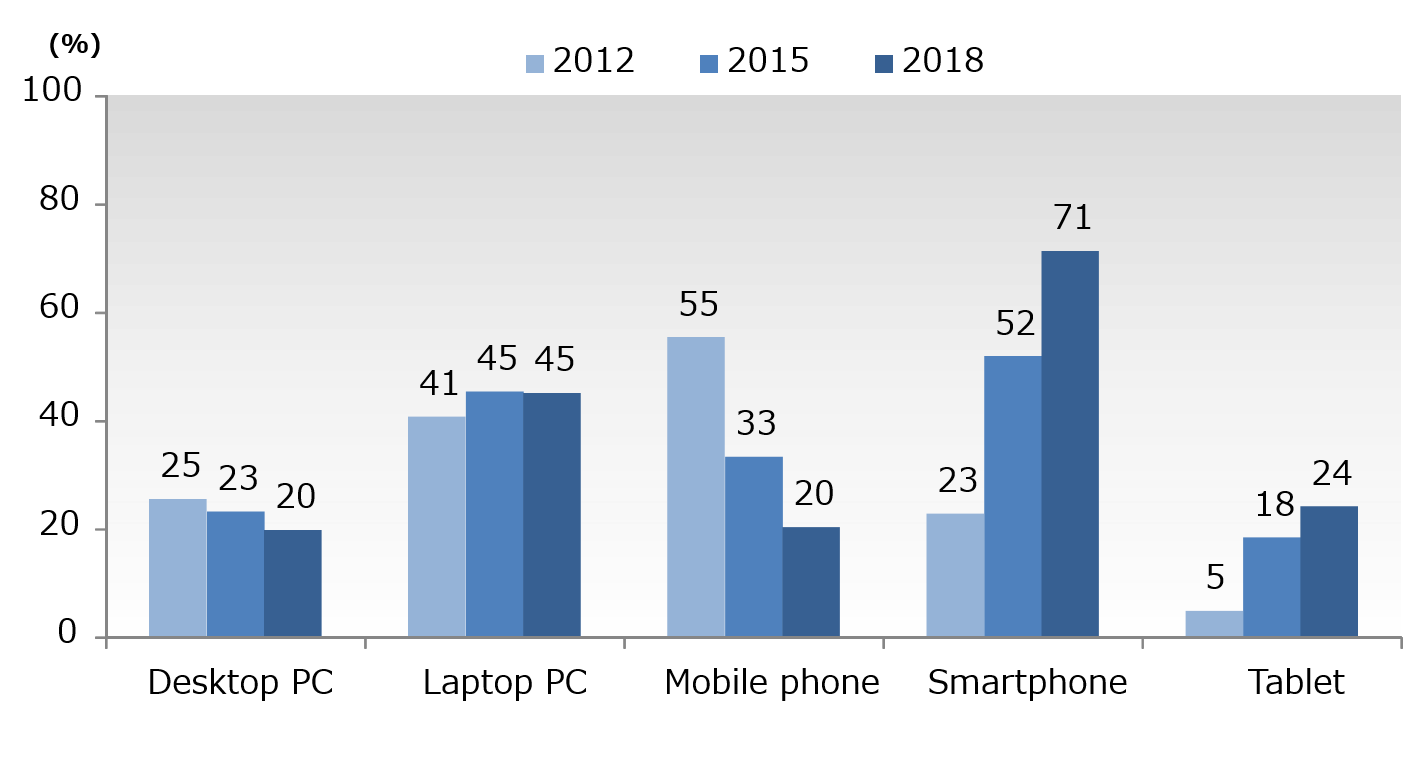
Source: NRI’s Survey of 10,000 Consumers (2012, 2015, and 2018)
Fig. 2: Changes in Values from 2015 to 2018
(Showing only items changing by at least 5 percentage points)
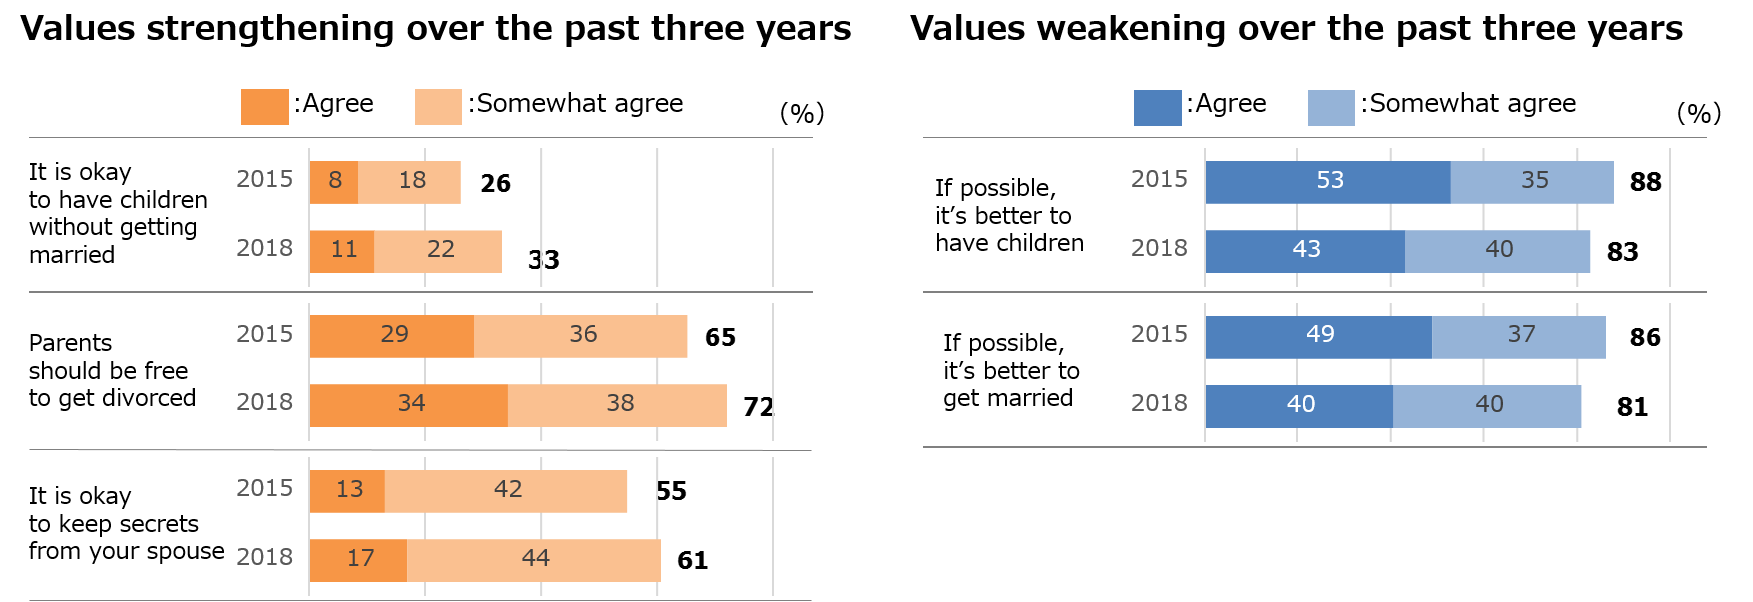
Source: NRI’s Survey of 10,000 Consumers (2015 and 2018)
Fig. 3: Changes in Outlook for Family Income This Year and Next Year
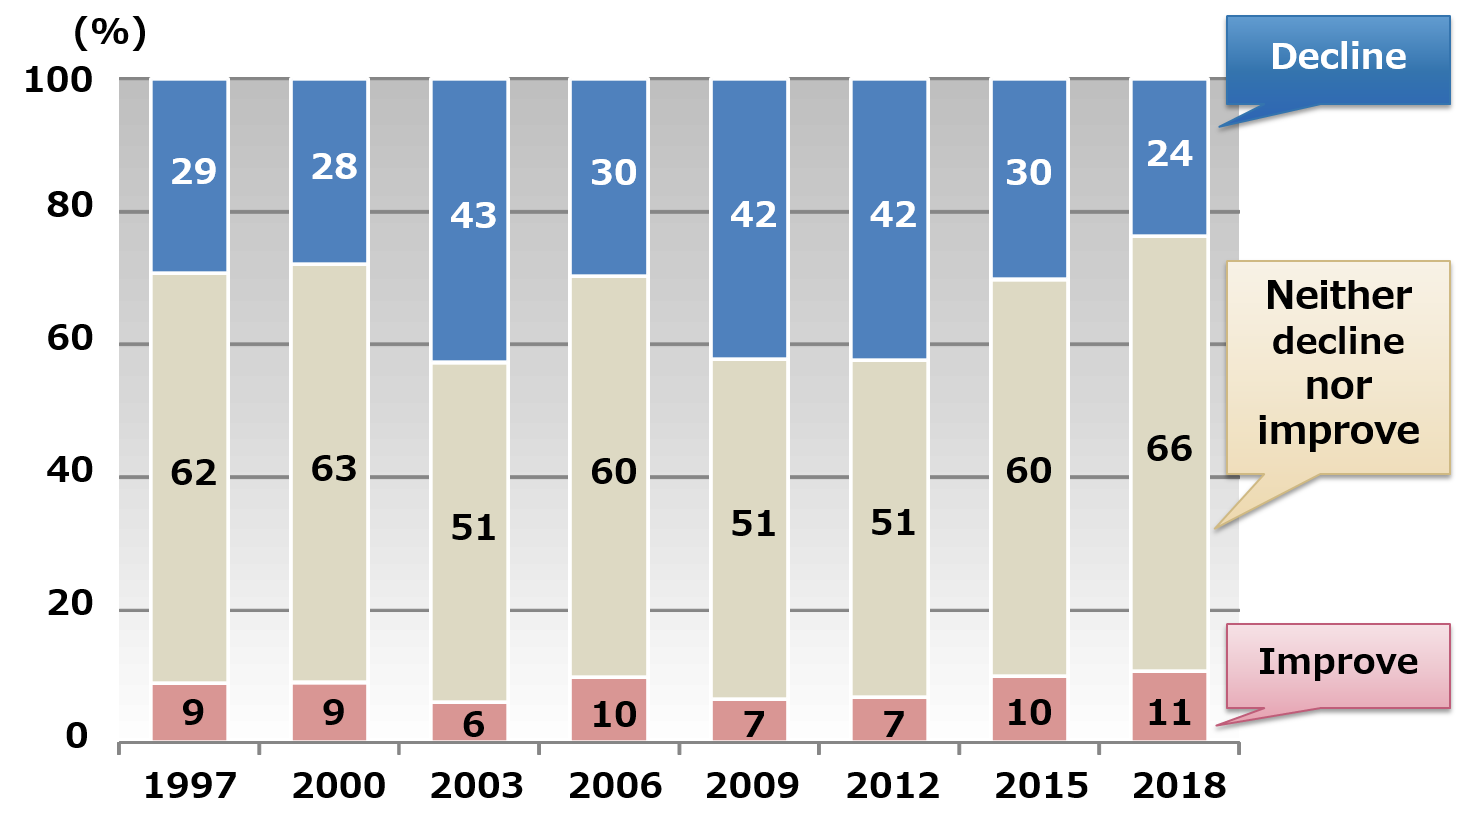
(Note) Total sample size for each year:
1997: 10,020; 2000: 9,982; 2003: 10,015; 2006: 9,994; 2009: 10,206; 2012: 8,771; 2015: 8,643; 2018: 8,375 (same age group targeted; excluding non-responses)
Source: NRI’s Survey of 10,000 Consumers
(1997, 2000, 2003, 2006, 2009, 2012, 2015, and 2018)
Fig. 4: Changes in Outlook Regarding Economic Change This Year and Next Year
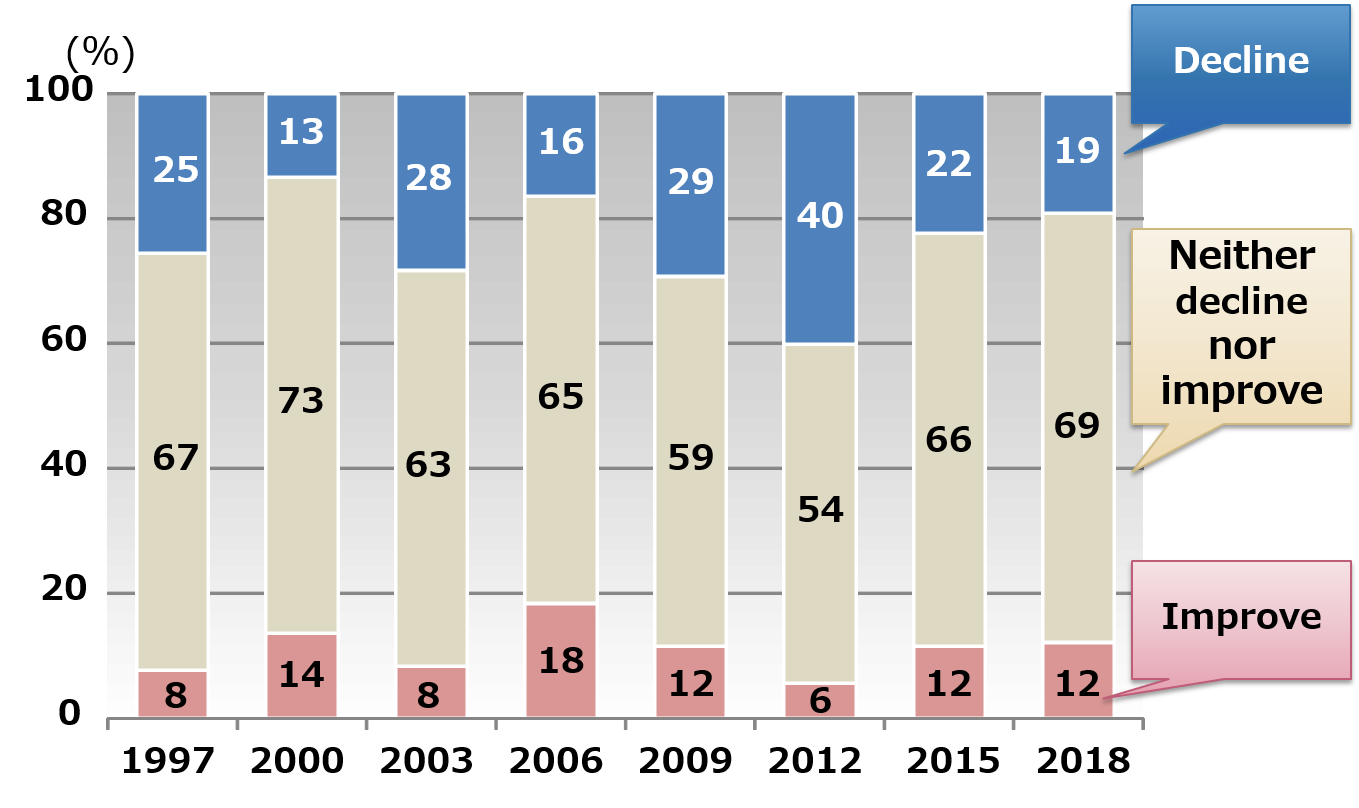
(Note) Total sample size for each year:
1997: 10,036; 2000: 9,993; 2003: 10,024; 2006: 10,004; 2009: 10,213; 2012: 8,773; 2015: 8,650; 2018: 8,378 (same age group targeted; excluding non-responses)
Source: NRI’s Survey of 10,000 Consumers
(1997, 2000, 2003, 2006, 2009, 2012, 2015, and 2018)
Fig. 5: Changes in Percentage of People Using Internet Shopping (By Age Group)
(Percentage of People Who Have Shopped Online in the Past Year)
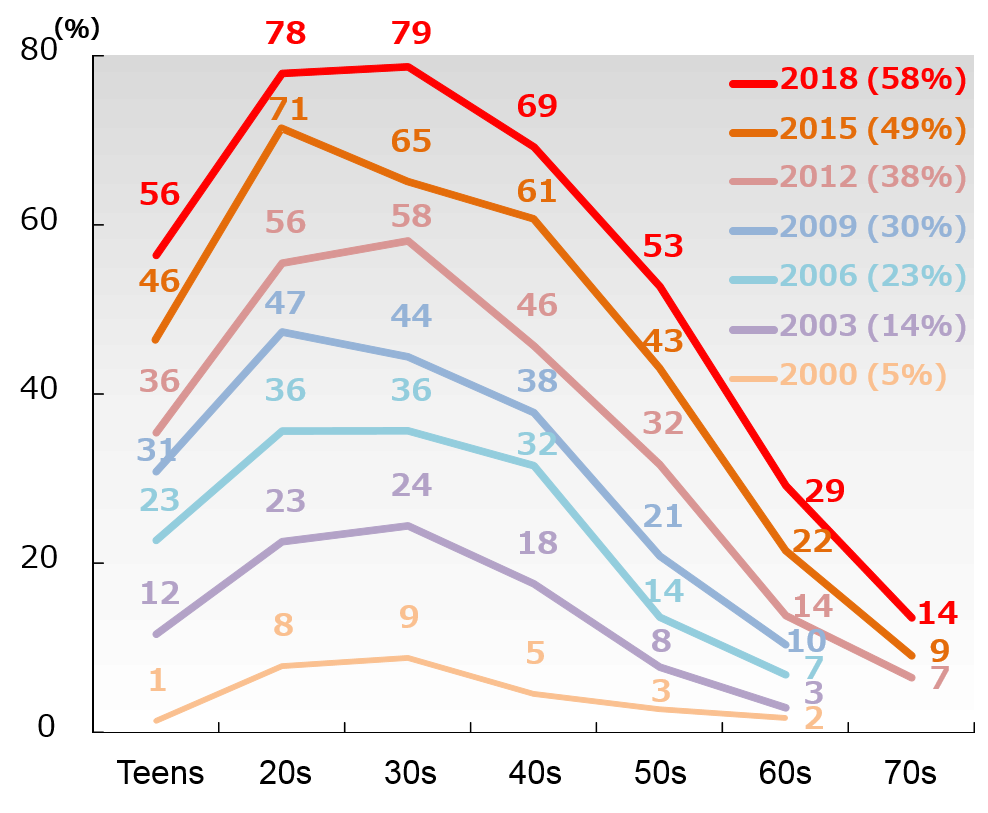
Source: NRI’s Survey of 10,000 Consumers
(2000, 2003, 2006, 2009, 2012, 2015, and 2018)
Fig. 6: Changes in Source of Information When Purchasing Products and Services(Multiple Responses)
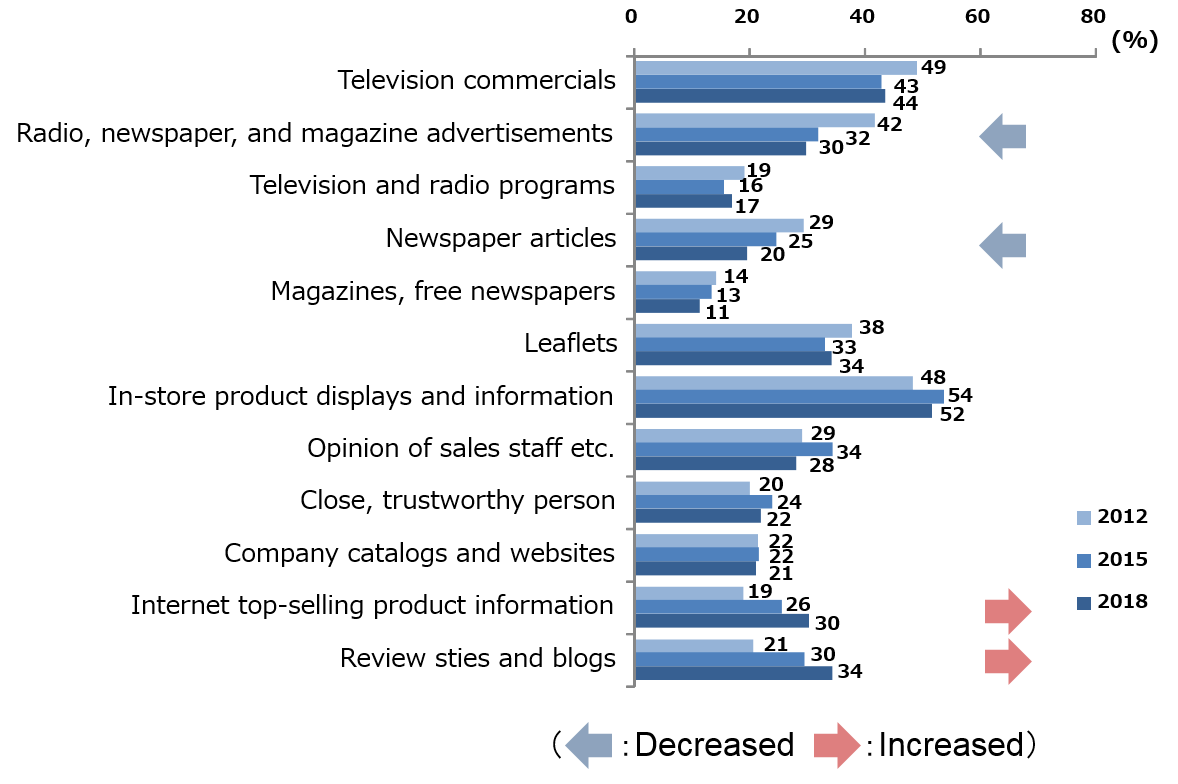
Source: NRI’s Survey of 10,000 Consumers (2012, 2015, and 2018)
Fig. 7: Changes in Distribution of Four Consumption Styles
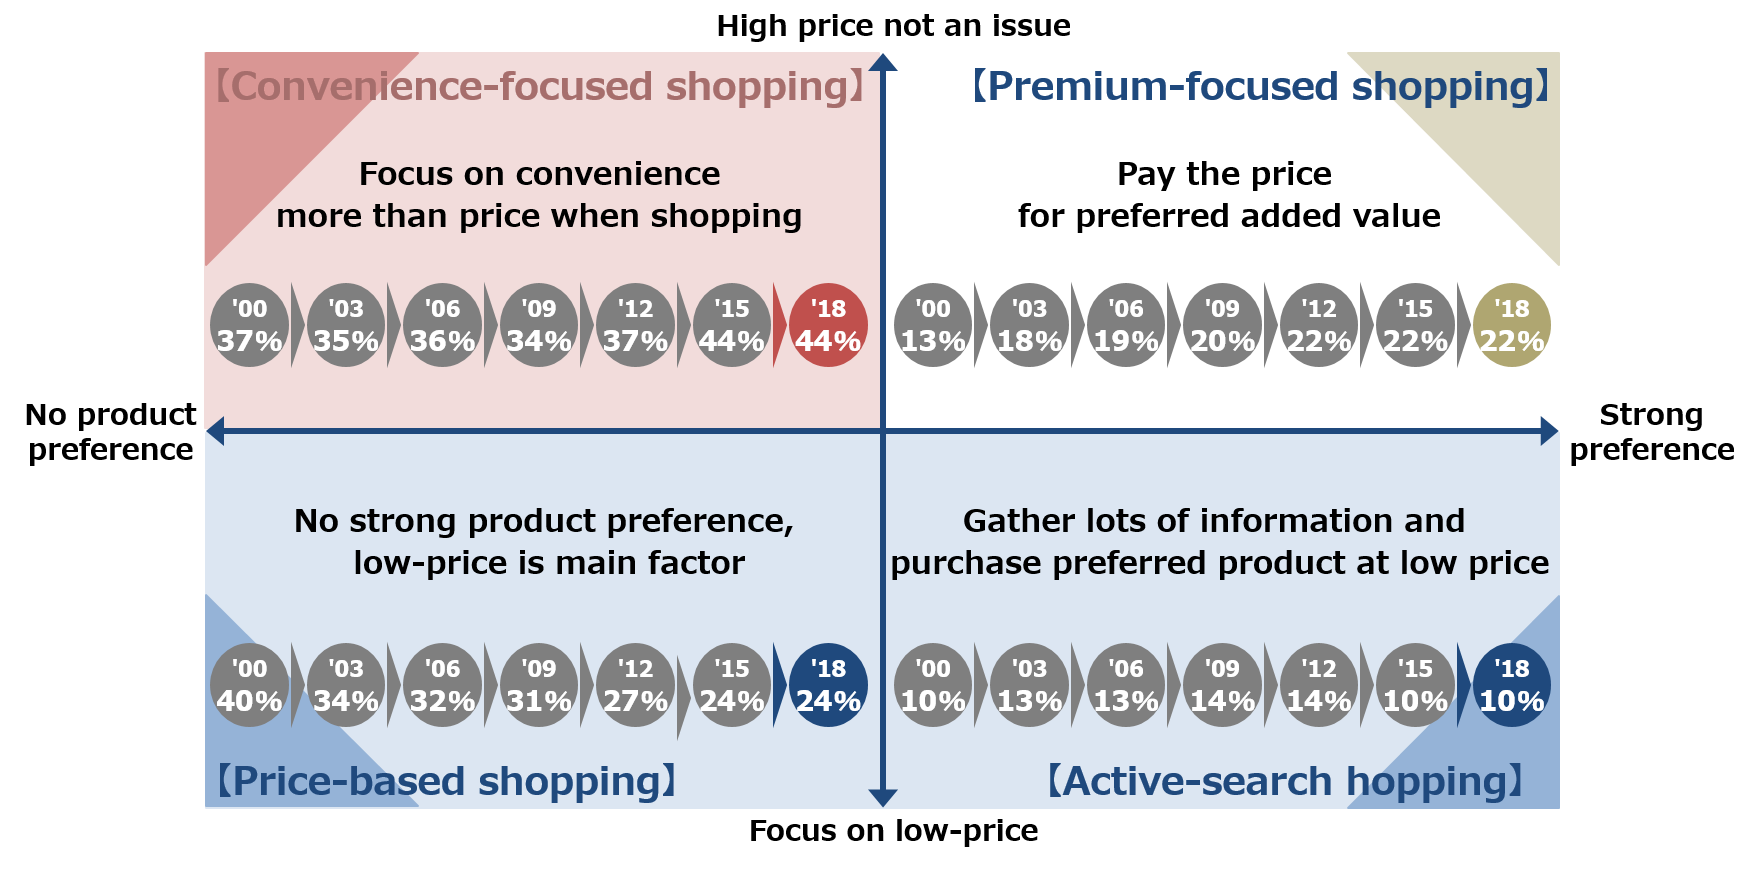
Source: NRI’s Survey of 10,000 Consumers
(2000, 2003, 2006, 2009, 2012, 2015, and 2018)
Inquiries
Media Inquiries:
Tamaoka, Togawa
Corporate Communication Department
Nomura Research Institute, Ltd.
TEL: +81-3-5877-7100
E-mail:
kouhou@nri.co.jp
Survey Coordinators:
Matsushita, Hayashi
Consulting Division
Nomura Research Institute, Ltd.