Tokyo, December 18, 2018 – Nomura Research Institute, Ltd. (NRI: Tokyo, Japan; Shingo Konomoto, President & CEO) has estimated the number of households and household asset size in Japan in 2017 as classified by the amount of net financial assets owned from various statistics. In February-March 2018, NRI conducted the "NRI Wealthy Parents*1 Questionnaire Survey" of people who were highly likely to be the children or grandchildren of affluent or High Net Worth Individuals (HNWIs) (obtaining valid responses from 684 individuals).The major estimation results and survey results are as follows.
■The Number of Japanese Households in the Affluent and HNWI Segments Exceeded the 2015 Figure and Was the Highest Since 2000
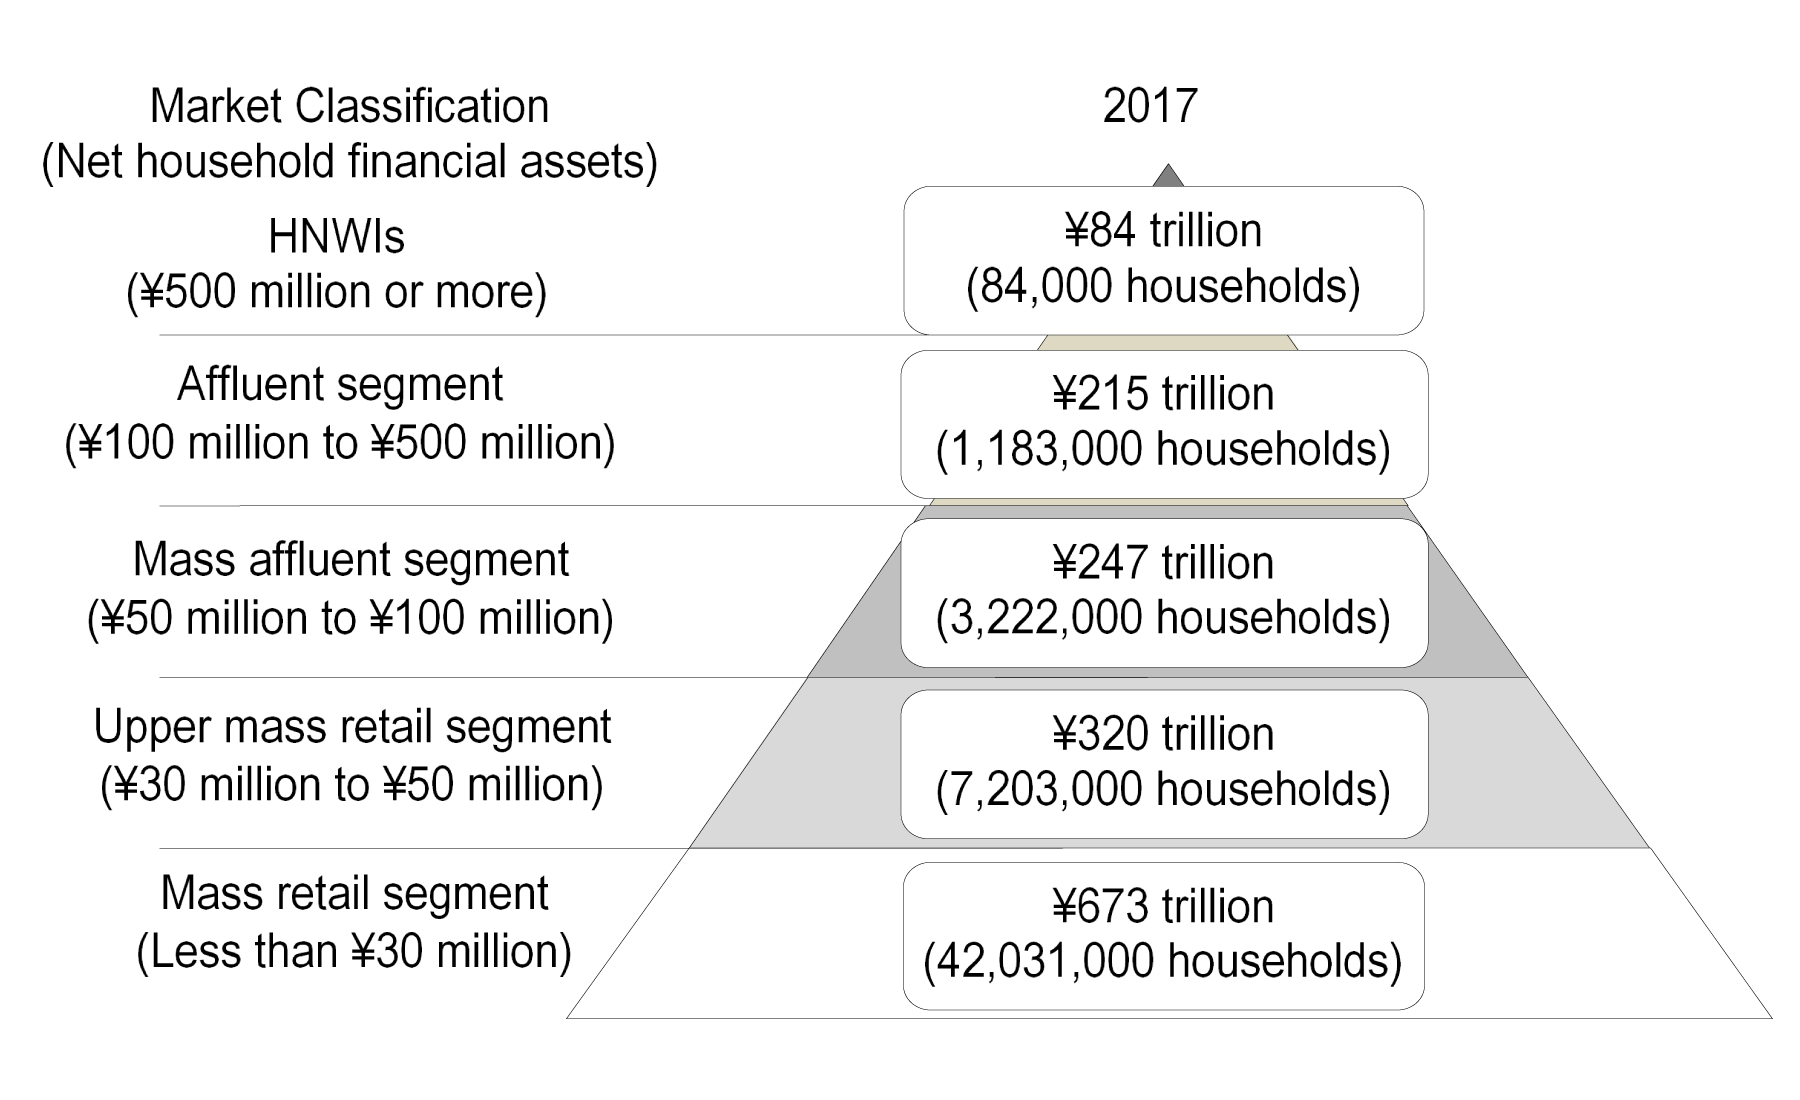
In estimating the number of households and household asset levels, NRI classified all Japanese households into five segments based on the amount of net financial assets owned (total value of financial assets minus debts) by households such as savings and deposits, equities, bonds, investment trusts, single-premium life insurance and annuities, etc. The result was that affluent segment holding net financial assets worth ¥100 million or more but less than ¥500 million and the HNWI segment holding net financial assets of at least ¥500 million consisted of 1,267,000 households. More specifically, there were 1,183,000 households in the affluent segment and 84,000 households in the HNWI segment (Figure 1).
Figure 1: Number of Households and Household Asset Levels as Classified by Net Financial Assets
-
Source:
Estimated by NRI based on the Annual Statistics Report of the National Tax Agency, the National Survey of Family Income and Expenditure of the Ministry of Internal Affairs and Communications, Vital Statistics of the Ministry of Health, Labour and Welfare, the Household Projections for Japan of the National Institute of Population and Social Security Research, the Tokyo Stock Index TOPIX by Tokyo Stock Exchange, Survey of 10,000 Consumers (Financial Edition) by NRI, and Survey of Affluent Segment by NRI.
The total number of households in the affluent and HNWI segment continued to increase from 2013 levels and stood at 1,267,000 in 2017. The total number of households in these segments was roughly 50,000 higher than the figure of 1,217,000 in 2015, which had been the peak since the year 2000, when NRI started making estimates using similar methods.
The number of households in each segment rose, reflecting an increase in nationwide households. Many of the households in the “Mass Affluent” segment holding net financial assets worth ¥50 million or more but less than ¥100 million and the affluent segment holding net financial assets worth ¥100 million or more but less than ¥500 million increased their assets and continued the trend of moving up into the affluent and HNWI segments respectively, as a result of economic expansion and rise in stock prices since 2013.
■Net Financial Assets of the Affluent and HNWI Segments Continue to Rise
Between 2015 and 2017, the affluent and HNWI segments saw the value of their net financial assets increase by 9.1%(from ¥197 trillion to ¥215 trillion) and 12.0%(from ¥75 trillion to ¥84 trillion) respectively, with the combined amount of both the segments increasing by 9.9% (from ¥272 trillion to ¥299 trillion). (Table 1)
Table 1: Trends in Number of Households and Household Asset Levels as Classified by Net Financial Assets Held
(2000-2017 estimate results)
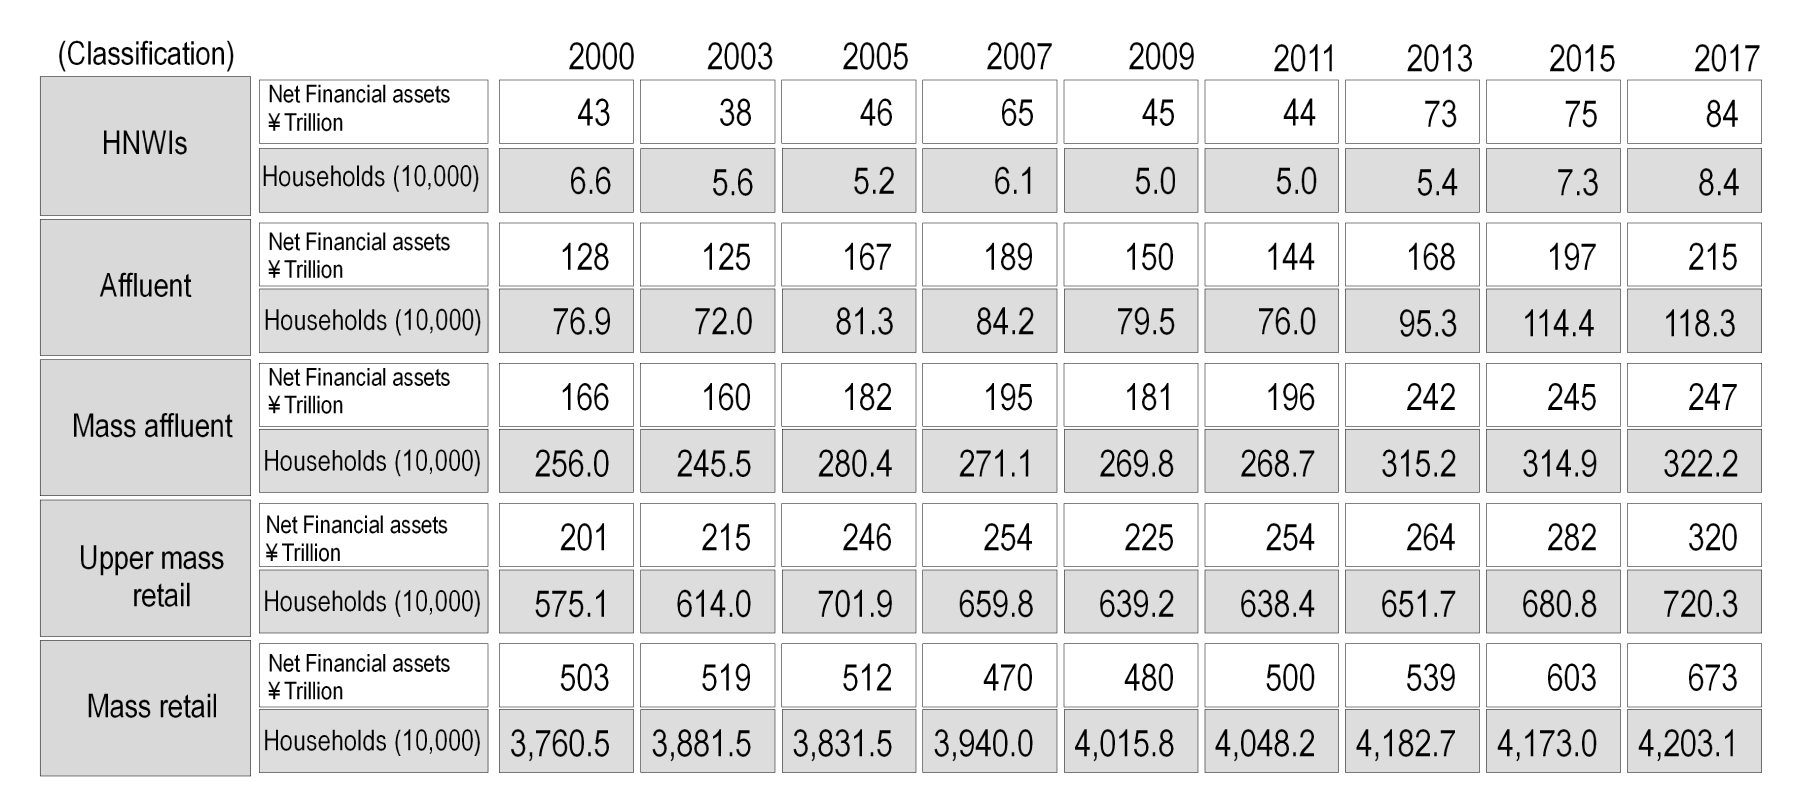
Note: The data on which the estimate was based is the same as Figure 1.
The increase in net financial assets owned by the affluent and HNWI segments is thought to be attributable to the expansion of assets held by the people in these segments due to economic expansion and rise in stock prices, in addition to one section of the mass affluent segment moving up to the affluent segment as a result of investment in financial assets. Additionally, households have become affluent and HNWI as a result of inheritance from parents and grandparents in the affluent and HNWI segment, and by receiving inter vivos gifts. It is also believed that the number of households which have increased their assets by starting their own business, opening up their IPOs (Initial Public offerings) or selling businesses are also increasing.
■“Wealthy Parents” category has higher financial literacy and financial information sensitivity than “Non-wealthy Parents” category
According to the survey, the level of financial literacy is high*2 in cases where parents or grandparents are likely to be in the affluent or HNWI segment (Wealthy Parents), with the ratio being 57% for males and 39% for females and being 21 percentage points higher for males and 19 percentage points higher for females when compared to “Non-wealthy Parents” *3. Also, rate of financial information sensitivity*4 (Wealthy parents: Male 13%, Female 10%) and interest rate sensitivity*5 (Wealthy parents: Male 65%, Female 65%) is higher for “wealthy parents” category as compared to “non-wealthy parents”. (Figure 2)
As the “wealthy parents” category has higher levels of financial literacy, financial information sensitivity and interest rate sensitivity in both males and females when compared to “non-wealthy parents” category, the individuals in this category are highly likely to actively adopt financial services utilizing new technologies and terminals such as FinTech and smartphones.
Figure 2: Characteristics of “Wealthy parents” and “Non-wealthy parents” Categories in Financial Literacy, Financial Information Sensitivity and Interest Rate Sensitivity (By Gender)
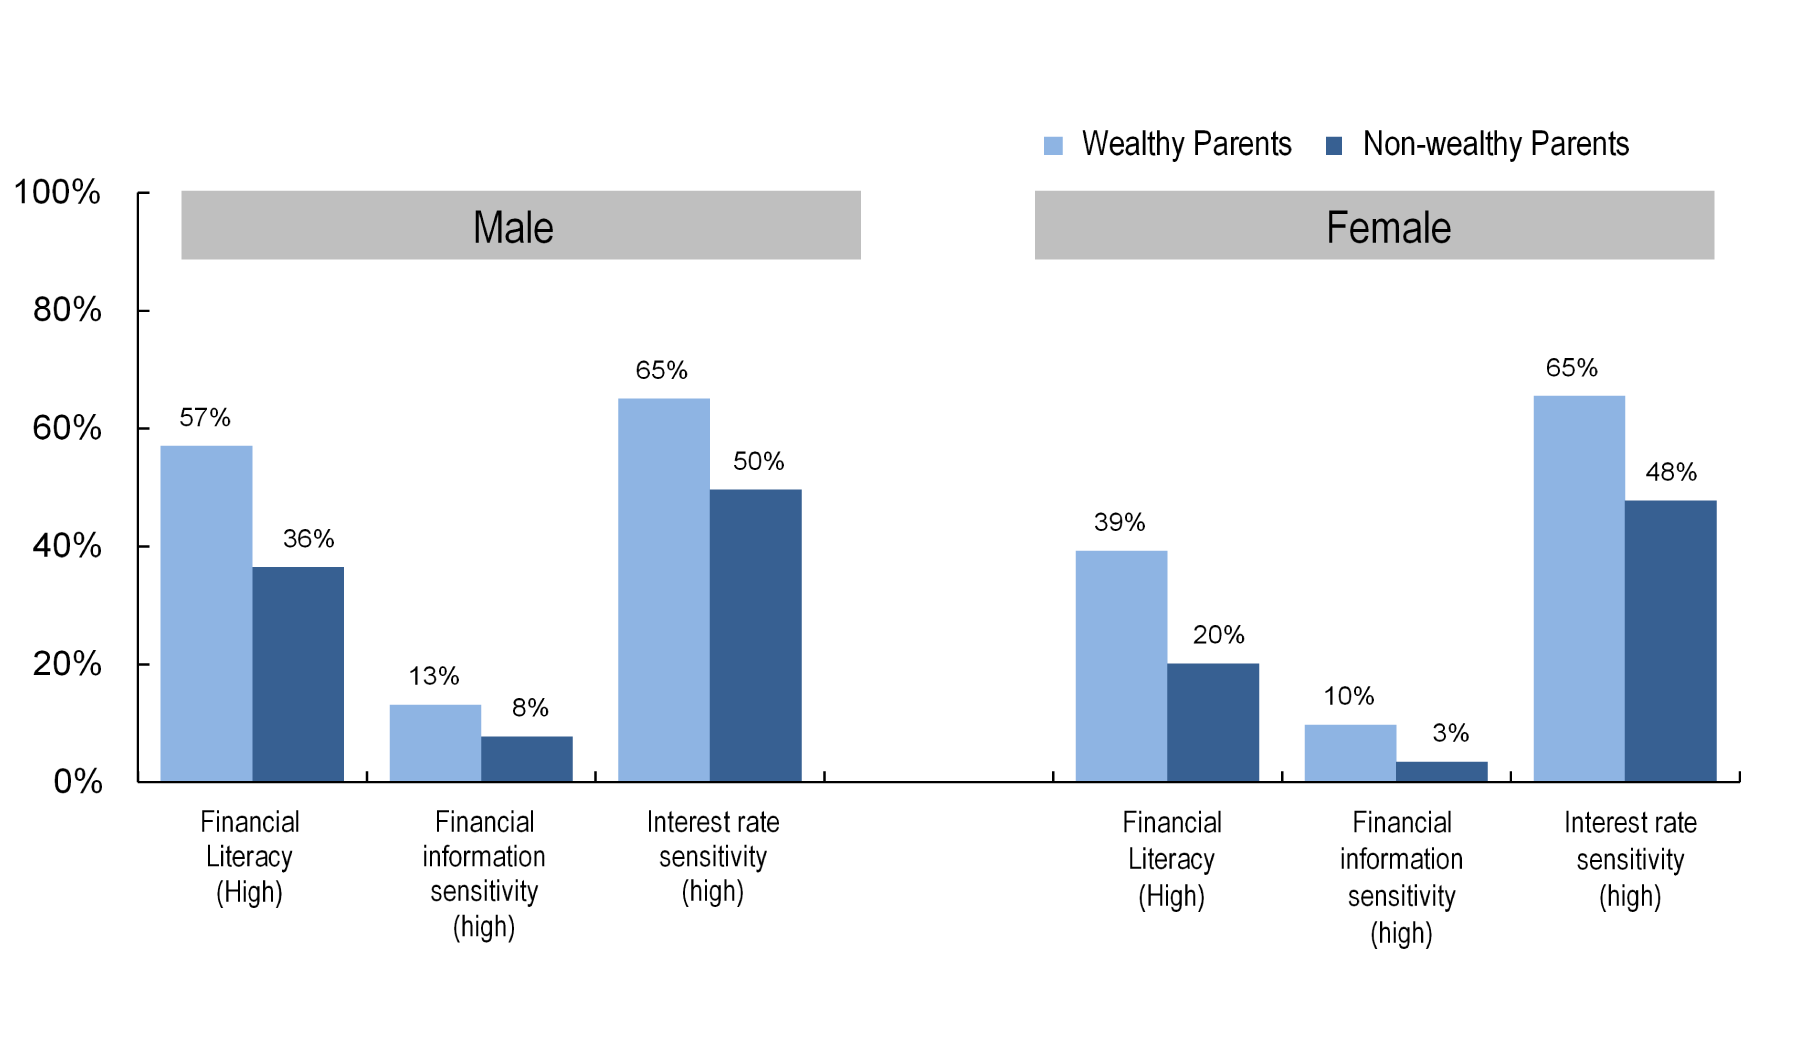
Note: For the meaning of each data point, refer to *2, 4 and 5.
Source: NRI Wealthy Parents Questionnaire Survey (2018)
■Individuals in the “Wealthy parents” category have strong sense of association with family members
Approximately 89% of males and 87% of females in the “wealthy parents” category answered “agree” or “rather agree” in reply to the question whether “Parents can be relied upon for mental support”, which is 8 percentage points and 6 percentage points higher than males and females in the “Non-wealthy parents” category, respectively. Additionally, 84% males and 78% females in the “wealthy parents” category felt positively about “Willing to spare generous amount of money for children’s education.”, which is 10 percentage points and 8 percentage points higher respectively, as compared to “non-wealthy parents” category (Table 2).
These results indicate that both males and females in the “wealthy parents” category are more conscious of their connections with their family in terms of trust and dependence on parents as well as investment on their children’s education.
Based on the result of the survey, 64% of males in the “wealthy parents” category felt that “It is desirable for the husband and wife to be financially independent of each other”, 7 percentage points higher than males in “non-wealthy parents” category. The proportion of individuals in the “wealthy parents” category “Reluctant to self or spouse working abroad” was 53% for males and 46% for females, 13 and 11 percentage points lower than males and females in the “non-wealthy parents” category, respectively. Males in the “wealthy parents” category were proactive on topics related to financial independence between husband and wife such as both of them being a working couple as well as individual savings and asset management. Both males and females in the “wealthy parents” category also thought more aggressively about living or working in a foreign country.
Table 2: Perspective on Relationship with Family
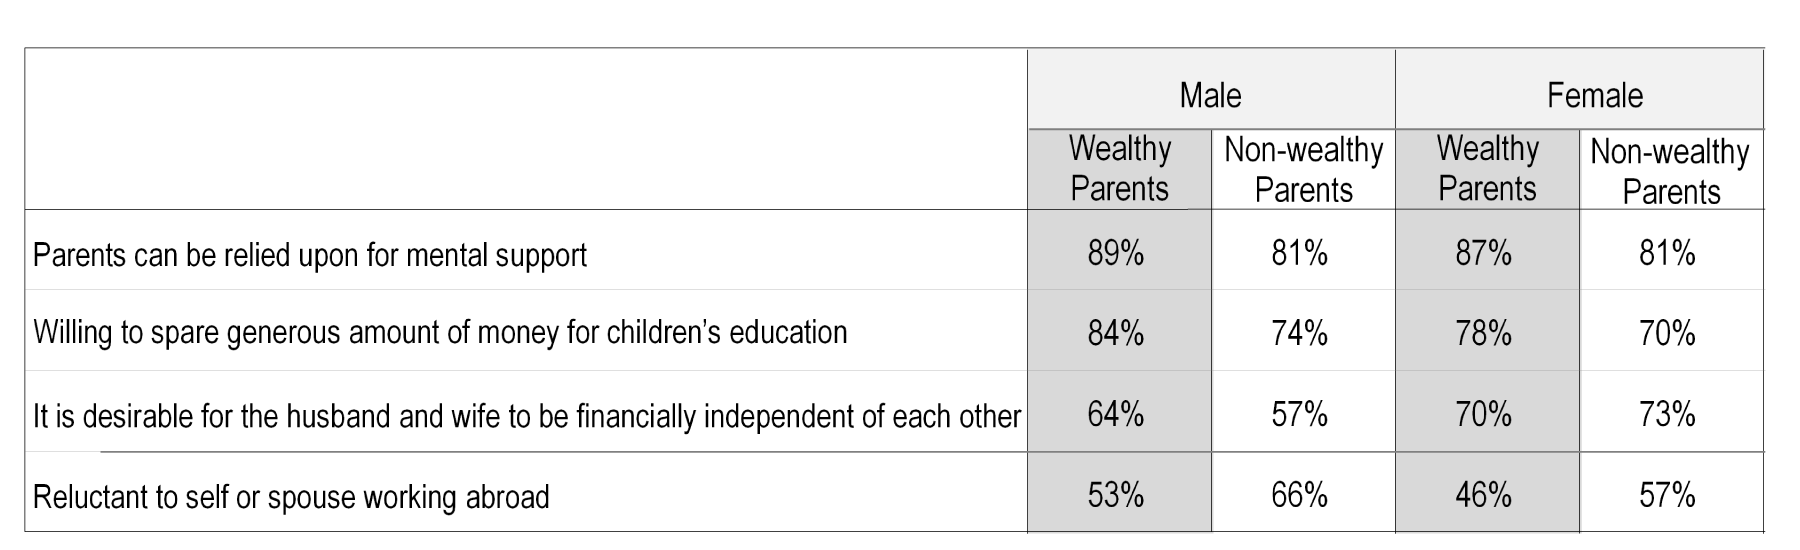
Note: Percentage of respondents answering either “agree” or “rather agree” for each option.
Source: NRI Wealthy Parents Questionnaire Survey (2018)
It is clear from the results that
the “Wealthy parents” category who have high asset transfers from their parents or grandparents and are receptive to new technology and ideas are expected to lead economic activities in Japan such as consumption and asset management in the future. With population and number of households declining, it is expected that inter-company competition will intensify in the future to capture the new and promising “Wealthy parents” market that will be responsible for driving future economic activity.
-
*1
Wealthy Parents:
Male and female respondents in their 20s to 50s who regarded their parents’ standard of living as “above upper middle” and responded that their parents possess some real estate other than a house (domestic or overseas), financial instruments such as stocks, bonds, investment trusts, luxury cars, art objects/ antiques, gold bullion or precious luxury metals. NRI regards those as children or grandchildren of wealthy family. -
*2
Financial Literacy (High):
Percentage of people who correctly answered 4 or more questions out of 5 questions related to finance (interest rate, compound interest, inflation, risk/return, diversified investment). -
*3
Non-wealthy Parents:
Male and female respondents in their 20s to 50s who did not fall in the "wealthy parents" category with their parents still alive. -
*4
Financial information sensitivity (High):
Percentage of respondents who responded “applicable” or “somewhat applicable” to the question of whether they “Actively collect information regarding a newly released financial product”. -
*5
Interest rate sensitivity (High):
Percentage of respondents who responded “applicable” or “somewhat applicable” to the question of whether their choice of “Financial institutions may change if the interest rate offered is good”.
About NRI
Founded in 1965, NRI is a leading global provider of system solutions and consulting services, including management consulting, system integration, and IT management and solutions for financial, manufacturing, retail and service industries. Clients partner with NRI to expand businesses, design corporate structures and create new business strategies. NRI has about 13,000 employees in more than 50 offices globally including New York, London, Tokyo, Hong Kong, Singapore, and Australia. NRI reports annual sales above $4.2 billion. For more information, visit https://www.nri.com/en
References
■Overview of “NRI’s Wealthy Parents Questionnaire Survey”
| Purpose |
To understand the views and characteristics of consumption/ financial behaviors of children with wealthy parents.
|
| Target |
"Wealthy parents" refers to 684 respondents (Male:272, Female:412) to the questionnaire in their 20s to 50s who regarded their parents’ standard of living as “above upper middle” and responded that their parents possess some real estate other than a house (domestic or overseas), financial instruments such as stocks, bonds, investment trusts, luxury cars, art objects/ antiques, gold bullion or precious luxury metals. For the purpose of comparison, the same survey was conducted with 267 individuals (Male: 131, Female: 136) in their 20s to 50s, who did not fall in the "wealthy parents" category with their parents still alive. |
| Survey Method |
To identify individuals in the "wealthy parents" category, preliminary internet research was conducted with the panel of the research firm. A list of 960 individuals in the "wealthy parents" category and 360 general individuals who did not fall in the category (total of 1,320 individuals) was extracted. A mail survey was then conducted with the 1,320 individuals. |
| Survey Period |
February-March 2018 |
■Five questions related to financial literacy
| Interest rate |
A deposit of ¥1 million is made in a savings account with an interest rate of 2% per annum. If there is no other payment or withdrawal from the account besides this, how much would the account balance be after one year? Please answer without taking taxes on interest received into consideration.
|
| Compound |
How much would the account balance be after years? Please answer without taking taxes on interest received into consideration. 1. More than ¥1.1 million 2. Exactly ¥1.1 million 3. Less than ¥1.1 million 4. Can’t be answered with just the above details. 5. Don’t know (Solution: 1. More than ¥1.1 million) |
| Inflation |
In case of high inflation, the prices of goods and services used in daily life increase rapidly.
|
| Risk/Return |
An investment with an above average return has an above average risk associated with it.
|
| Diversified Investment |
It is usually a safer investment to buy a stock of a company rather than buying an equity investment trust (a financial product that invests in the stocks of a number of companies).
|
Inquiries
Media Inquiries:
Sangi Tamaoka, Yasuo Togawa
Corporate Communications Department
Nomura Research Institute, Ltd.
TEL: +81-3-5877-7100
E-mail:
kouhou@nri.co.jp
Survey Coordinators:
Hiroyuki Miyamoto
Consulting Division
Masaki Ryomoto, Kai Kawate, Hirotaka Takenaka
Finance Consulting Department
Nomura Research Institute, Ltd.